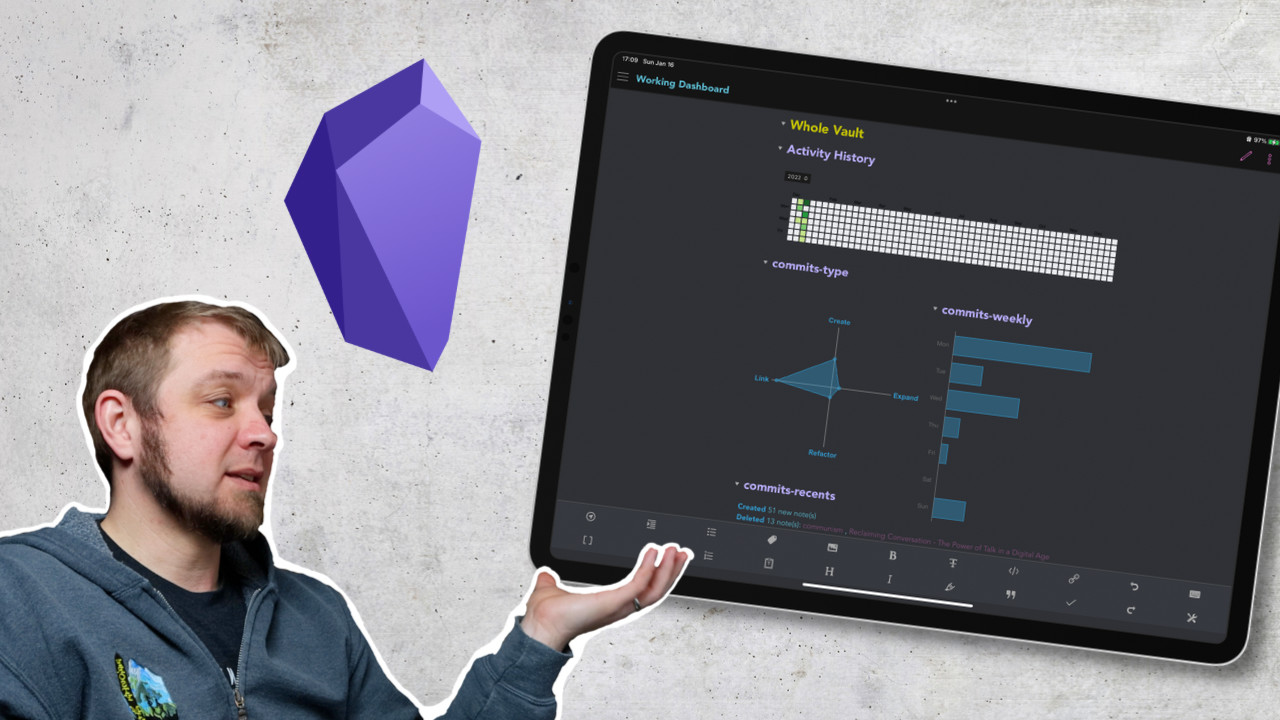
One of the things I always enjoy about my Github Profile is that it shows I write code regularly. No I’m not on some huge streak, but it does show I make some progress all the time.
With a few plugins for Obsidian you can create something similar for your writing projects. Today we’re going to look at the Activity History and Obsidian Commits plugins so we can see how you create a writing progress dashboard. Both of these Obsidian plugins have been built by Darakah.
Before I show off my dashboard let’s look at all the options.
Activity History
Once you have Activity History installed you’re going to need to go to the settings and add your project. By default, it will start tracking the whole vault once it’s installed, and while I do like that, I also want individual projects.
To track a project located at Long Form/Community/Drafts you need to type that path into the Track Project field and then press Enter. You get no visual feedback so click the settings for one of the other extensions and then select Activity History again. You should now see your project listed in the tracked projects. If you made an error, type the path of the error into the Stop Tracking Project field and hit enter, again no visual feedback happens.

Now you’re ready to add the Activity History to your dashboard page with the code below.
Long Form/Community/Drafts
You can see I’ve specified a writing project about building good community. You will see the graph show up right away, but Activity History only tracks changes going forward so you won’t see any changes made before you told it to track the project in question. If you want it to track your whole vault then use / where I have the project line.
Obsidian Commits
This works very similar to Activity History in that you need to tell the plugin to track individual projects, and it only starts tracking changes after you’ve told it to track them. Unlike Activity History, this plugin at least provides a button to add your project to the tracked list, but it still doesn’t give you any visual feedback that you’ve tracked a project until you click to the settings of another project and then come back.
There are 4 types of data you can get out of the commits plugin.
- The type of commit you made.
commits-type - The weekly commit stats.
commits-weekly - Your daily commits stats.
commits-daily - A list of the recent commits.
commits-recents
For the commits-type, commits-weekly and commits-daily types you have 7 arguments to set your preferences.
project– allows you to define the project that you’re trackingdivWidth– allows you to set the width of the container in %divHeight– lets you set the height of the graph in pixelsfillColor– lets you set the color of the graph using standard HEX notation or color namesborderColor– lets you control the color of the bordersgridColor– lets you control the color of the griddivAlign– can set the graph to float left or right
For commits-recents you the following arguments:
project– same as abovedivWidth– same as abovedivHeight– same as abovefillColor– same as abovedivAlign– same as abovetopCommits– a number to decide how many commits you want to see per type in the recent commits block
Now that we have some idea of what we can do with the plugins let’s look at setting up a writing dashboard.
Writing Dashboard
For my Community writing project, I’m using 3 different queries. First is the Activity History plugin to visualize how much progress I’m making on a regular basis. At this point, it doesn’t look like much, but it only starts tracking after it’s installed and told to track a project so it’s missing all my old work.
Long Form/Community/Drafts
Next up I have the commits-daily and commits-recents queries set up to have an idea of when I write and what has changed in the project. I’ve set them both to 50% width and aligned one to the left and one to the right so that they show up side by side.
project=Long Form/Community/Drafts
divWidth=50
divAlign=left
project=Long Form/Community/Drafts
divWidth=50
divAlign=right
That’s really it. In theory, having a dashboard like this will help you keep making some progress all the time on your writing projects. Maybe you can fill your Activity History chart with some long streaks of writing so that you finish the project.
Small Issues
There is one small issue with both plugins and how they format if you’re using the newer Obsidian Live Preview feature. The alignment won’t work properly if you have anything lower on the page. To solve this, just leave all your graphs fullwidth by not setting any value for the floats or the widths and it will work fine.
I was pleasantly surprised to see that both of these plugins work on mobile without issues.
